|
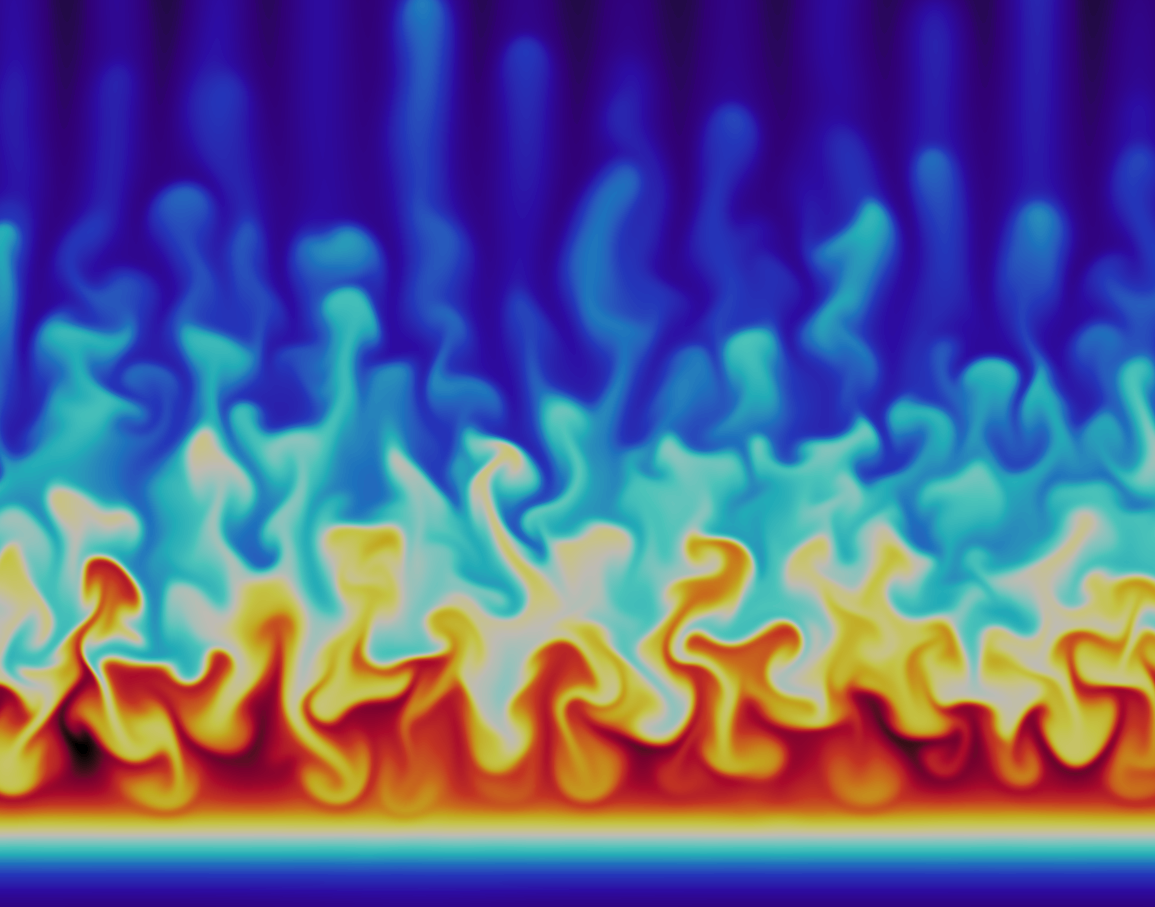
A simulation of edge turbulence in the scrape-off layer of tokamaks. The simulation represents the flow in the radial plasma density ρ, coupled to the vorticity and electrostatic potential run to 32,000 gyroperiods. The actual plot is a color map of the log-density χ. This simulation was run to fourth order accuracy on 65536 finite elements using a discontinuous Galerkin formulation on 256 cores of TACCs stampede supercomputer. The ArcOn software was used to run this simlation.
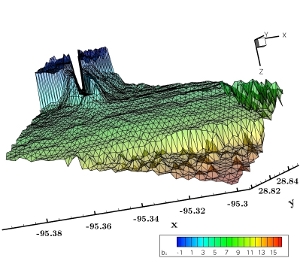 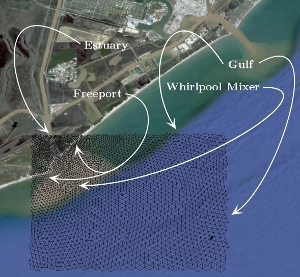
Here we show a parametrization of the Brazos river estuary. On the left is the finite element mesh superimposed over a Googlemap. On the right is the corresponding bathymetry tracking the ocean topography. The problem studies the estuary eutrophication problem caused by fertilizer runoff in the Gulf of Mexico region.
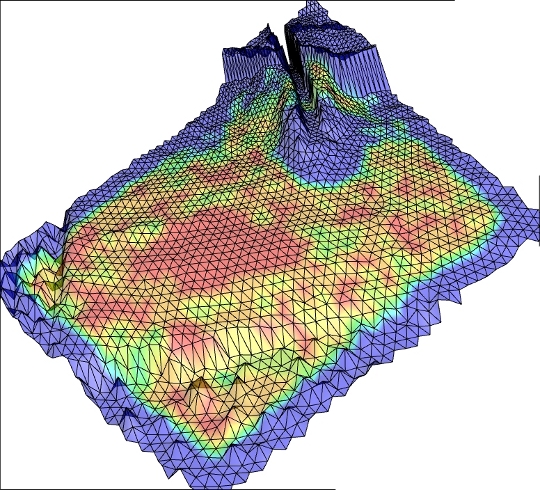
This shows the p-enrichment of a solution meshed over the Brazos estuary of the gulf of Mexico. The solution retains the greatest resolution, using this particular p-enrichment scheme (which in this example is a fixed tolerance p-enrichment program), in areas of deep bathymetry, while near the river outlet, tidal inlets and coastline the p value is lowered. The chemistry of the solution tracks an esturay eutrophication study of a multicomponent flow following the phosphates (iota) present in fertilizer run-off upstream. See a movie of phosphate level tracking here (click).
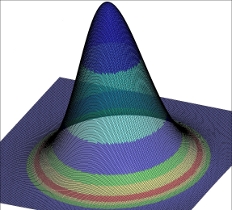 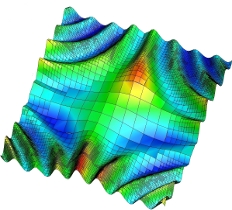 On the left is a dioristic energy scheme for dynamic p-enrichment, based on a coupled global energy consistency. On the right is a similar dioristic energy scheme applied to element boundaries, where dynamic h-adaptivity is achieved. These schemes are naturally coupled to provide dynamic hp-adaptivity by way of dioristic energy. On the left is a dioristic energy scheme for dynamic p-enrichment, based on a coupled global energy consistency. On the right is a similar dioristic energy scheme applied to element boundaries, where dynamic h-adaptivity is achieved. These schemes are naturally coupled to provide dynamic hp-adaptivity by way of dioristic energy.
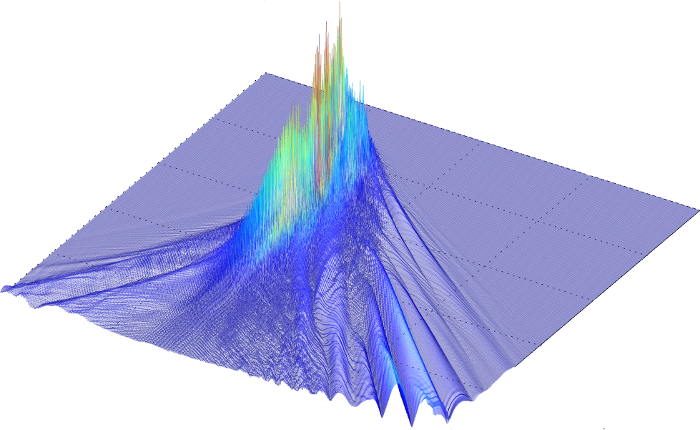 Here we demonstrate the importance of setting proper boundary conditions in solutions to nonlinear systems of PDEs, showing the difference map in a solution of the quantum hydrodynamic (QHD) equations using a Dirichlet boundary condition set to the initial condition, versus a first order transmissive boundary condition. The difference between the two solutions quickly becomes much more pronounced given more realistic initial-boundary data. Here we demonstrate the importance of setting proper boundary conditions in solutions to nonlinear systems of PDEs, showing the difference map in a solution of the quantum hydrodynamic (QHD) equations using a Dirichlet boundary condition set to the initial condition, versus a first order transmissive boundary condition. The difference between the two solutions quickly becomes much more pronounced given more realistic initial-boundary data.
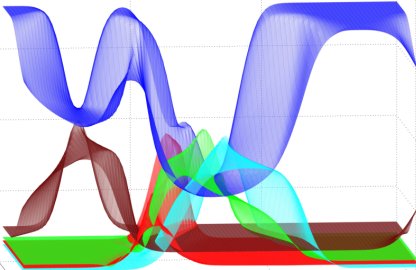
A graph of the evolution in time t of the concentrations of an n=5 fluid mixture of inert gases using a viscous compressile barotropic Navier-Stokes model comprised of: Ar, Kr, SO2, O2 and H2O at 293 Kelvin. Here we use periodic boundary conditions with a second order Runge-Kutta time integrator.
|