| Biography | Research | Publications | Teaching | Group | Projects | Software | Sponsors | Collaborators |
|
||
|
Collaborators Collaborator list Our Computational
Visualization Center, is also part of a multi-institutional planning
grant NIH-P20 RR020647-01, Computational
Center for Biomolecular Complexes (C2BC),
linking the National Center for
Macromolecular Imaging, Baylor College of
Medicine (Dr. Wah Chiu), the
PDB and Structural Biology research, Rutgers
University (Dr. Helen
Berman), and the Molecular
Graphics Laboratory, The Scripps
Research Institute (Dr. Art Olson).
The principal aim is to develop a virtual center spanning the four
institutions to foster computational techniques and tools for large macromolecular
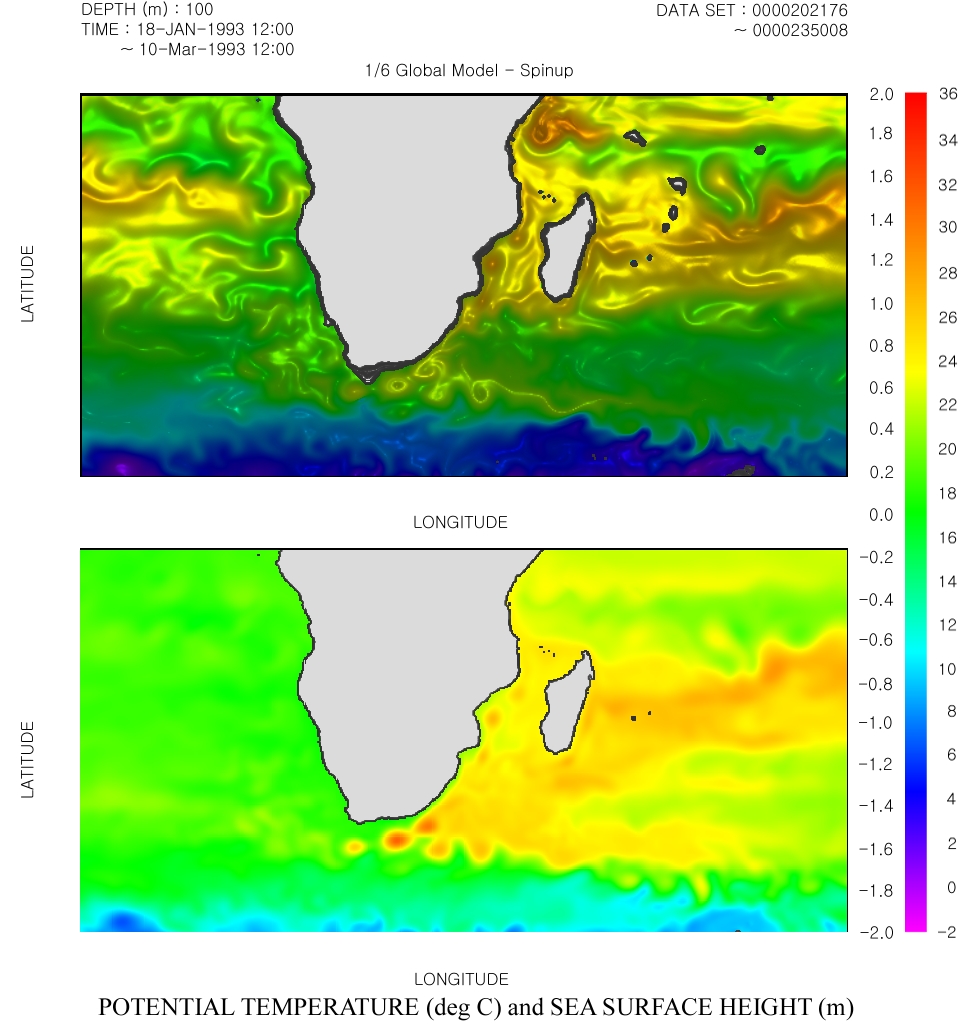
structural biology. Our Computational Visualization Center, has collabrated with Earth Simulator Center(Dr. Tetsuya Sato), Yokohama, Japan for extremely large dataset (22GB). Their transient oceanographic dataset consists of 5 variables: temperature, salinity, U, V, W (velocity) and 4 timesteps spread over 3days. Our enhanced software is applied to a range of oceanographic datasets received from the Earth Simulator Center, and several graphics and movies are summarized on our project webpage for the Earth Simulator Project. |
